
The Sellers Winning Right Now All Did One Thing First
The sellers getting the best results this fall have one thing in common: they priced for today's market on day one.
That is not a hunch. It is the clear message from the October 2026 Real Estate Agent
Survey by John Burns Research and Consulting, which polls about 500 agents across the country every month. When that many agents describe the same shift, it is worth paying attention.
Here is what the data shows, what it means for you, and how to put it to work if you are thinking about selling in the near future.
The market has shifted toward buyers
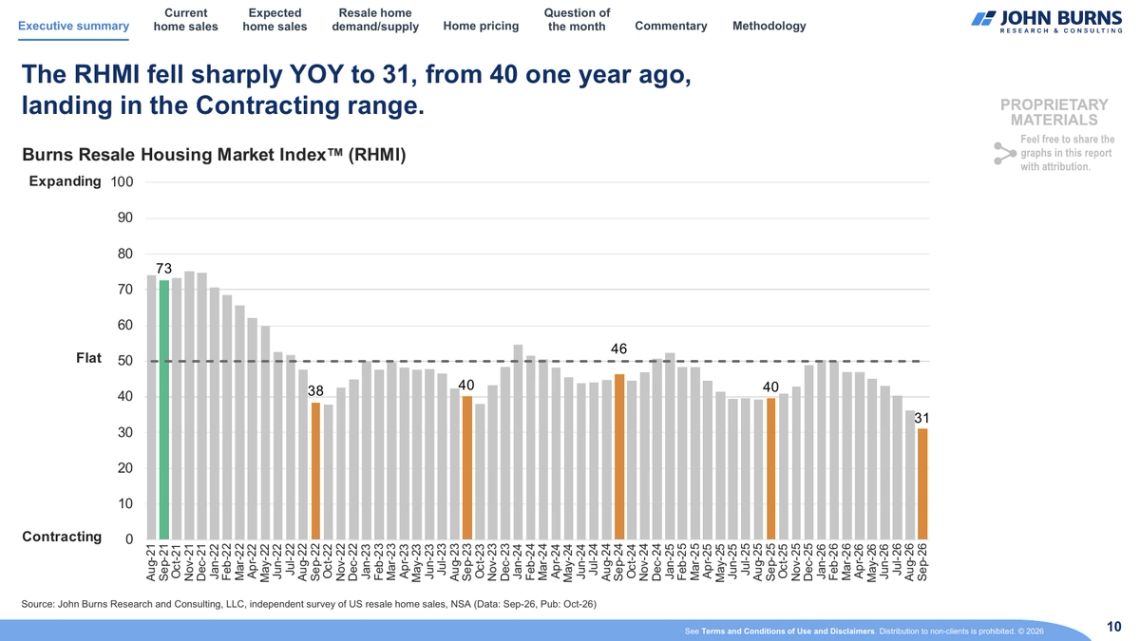
John Burns tracks a single number that sums up the health of the resale housing market. They call it the Resale Housing Market Index. A score above 50 means the market is expanding. A score below 50 means it is contracting.
In September 2026, the index came in at 31. That is the lowest reading since the survey started in August 2021. One year earlier it was 40, and two years earlier it was 46.
The Burns Resale Housing Market Index from 2021 to today
The index is built from three parts, and all three moved in the same direction:
Current sales: 22 out of 100, meaning most agents see sales running slower than normal for this time of year.
Expected sales over the next six months: 41 out of 100, the weakest outlook in survey history .
Supply versus demand: 39 out of 100, also a survey low, which means more homes are available than there are buyers ready to purchase them.
In plain terms: buyers have more choices than they have had in years, and they are taking their time.
More sellers than buyers in most of the country
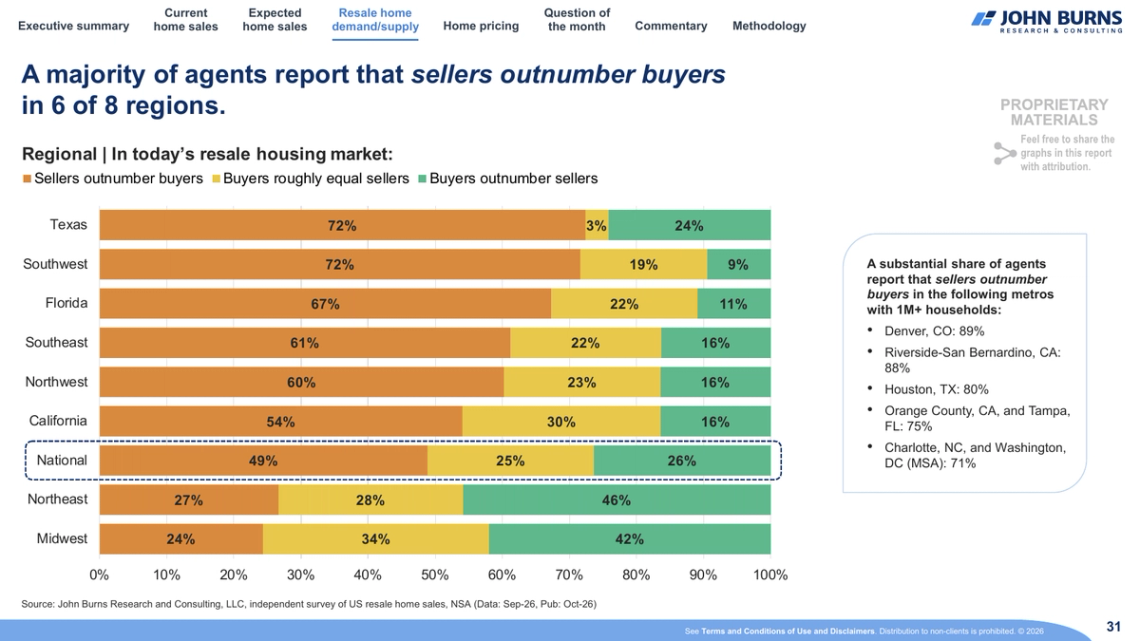
One finding stands out above the rest. Nearly half of agents nationally (49%) now say sellers outnumber buyers in their market. That is the highest share John Burns has ever recorded.
In California, 54% of agents say sellers outnumber buyers, while only 16% say buyers outnumber sellers.
Share of agents reporting more sellers than buyers, by region
When buyers have options, they compare. Every listing gets measured against every other listing in the same price range. The home that looks like the best value wins the showing, the offer, and the clean escrow .
Why your first price matters more than ever
John Burns gives agents direct advice in this report: Help sellers set the initial price for the current environment, rather than reacting later to a lack of offers.
I agree, and here is why it works in your favor .
Your listing gets the most attention in its first two weeks. Buyers set up saved searches and alerts. When your home appears, every active buyer in your price range sees it at once. That first wave of attention is your best chance to create real interest.
A well-priced home gets compared favorably. In a market with more choices, buyers line up homes side by side. A home priced in step with the market looks like the smart choice. That is how you earn the strongest offer.
Price adjustments send a signal. When a home sits and then drops in price, buyers notice. Many will wait for the next reduction instead of making an offer now . Starting at the right number keeps you in control of the conversation.
You protect your timeline. Most sellers are also planning their next move. Pricing right from the start helps you sell on your schedule, so you can focus on what comes next.
What this means for local sellers
The survey reports national and regional trends. It does not break out Ventura County, and every neighborhood moves at its own pace.
Local Trends in 4 Areas
Oak Park: 56% more homes on the market than for the same period one year ago, 4 out of 10 active sellers have had to drop their price in order to be competitive.
Simi Valley: There has been a 16% jump in the numbers of homes for sale in the city compared to last year with marketing times going up 6 days on average to a total of 51 days on market.
Camarillo: Inventory has risen 27% with 181 homes currently for sale. This is a significant jump from 2025. 46% of active homeowners have dropped their prices.
Thousand Oaks: The number of homes on the market has risen by 14% this year with a total of 201 current listings available. Blended list price is down 4.4% to $1,189,000
Trying to predict what will happen from month to month in any market can be difficult. That is exactly why local pricing strategy matters. A national trend tells you the direction of the market. Your neighborhood data tells you where to set your number .
How to price your home for today's market
Here is the process I walk every seller through before we go live:
1. Start with the most recent sales. I look closely at homes that closed in the last 60 to 90 days, because they reflect what buyers are paying now .
2. Study the competition. Active and pending listings show what buyers are choosing between today . Your home needs to stand out among them.
3. Look at what did not sell. Expired and withdrawn listings show where buyers said no. That is valuable information.
4. Prepare the home to shine. Presentation, photography, and small repairs help your home earn every dollar of its value.
5. Set a clear plan for the first 14 days. We agree in advance on how we will measure showings, feedback, and interest, so decisions are based on facts.
The bottom line
This market rewards preparation. Buyers are active, informed, and selective. The sellers who succeed are the ones who meet the market where it is from day one.
If you are thinking about selling in the Conejo Valley, let's talk about the right price for your home in today's market. Reach out to schedule a no-pressure pricing consultation.
Source and credit: National data and graphs come from the John Burns Research and Consulting, LLC, Real Estate Agent Survey, October 2026. Graphs are shared with attribution as permitted by John Burns Research and Consulting. Local market figures are from Zillow and Realtor.com, September 2026.